* 본 포스트는 개인연구/학습 기록 용도로 작성되고 있습니다.
[Python] 전국 인구 현황 지도 시각화
By MK on August 18, 2019
folium를 활용해 지도에 지역구 영역을 표시하고 인구 현황을 시각화해보자.
해당 포스트에서 커버되는 내용
- 대한민국 행정구역 시각화
- 인구 버블맵 표현
- 인구 히트맵 표현
필요한 라이브러리
import requests
import json
import pandas as pd
import numpy as np
from pandas.io.json import json_normalize
import os
import webbrowser
import folium
from folium import plugins
print(folium.__version__)
1. 대한민국 행정구역 시각화
행정구역 정보를 담고 있는 json 파일을 생성한다.
json 파일을 생성 및 다운로드할 수 있는 링크 https://blog.naver.com/PostView.nhn?blogId=kcchang61&logNo=221350672356
state_geo = 'TL_SCCO_SIG_WGS84.json'
2. 인구통계 데이터 로드
통계청 오픈 데이터를 가공해 csv 데이터를 생성한다.
데이터 헤더는 [‘CODE’, ‘POPULATION’] 으로 구성되어 있다.
코드가 숫자로 인식되어 오류가 생기는 경우가 발생하므로 zfill(5) 처리를 해준다.
state_unemployment = './datas/population_201907.csv'
state_data = pd.read_csv(state_unemployment, encoding = 'euc-kr')
state_data.columns = ['CODE', 'POPULATION']
state_data['CODE'] = state_data.CODE.map(lambda x : str(x).zfill(5))
state_data.head(1)
| CODE | POPULATION |
|---|---|
| 50130 | 181631 |
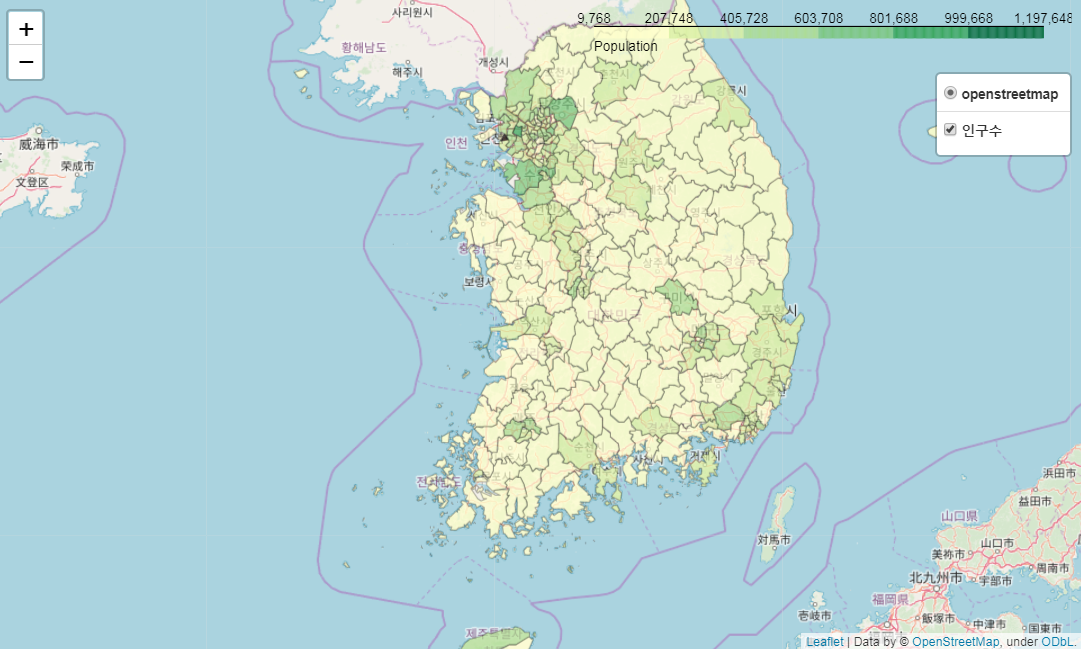
3. 행정구역별 인구현황 시각화
컬러는 fill_color 설정을 통해 변경할 수 있다.
** 사용가능한 컬러 확인 ** https://plot.ly/ipython-notebooks/color-scales/
# Initialize the map:
m = folium.Map(location=[36, 127], tiles="OpenStreetMap", zoom_start=7)

m.choropleth(
    geo_data=state_geo,
    name='인구수',
    data=state_data,
    columns=['CODE', 'POPULATION'],
    key_on='feature.properties.SIG_CD',
    fill_color='YlGn',
    fill_opacity=0.7,
    line_opacity=0.3,
    color = 'gray',
    legend_name = 'Population'
)

folium.LayerControl().add_to(m)

# Save to html
m.save('folium_kr.html')
webbrowser.open_new("folium_kr.html")
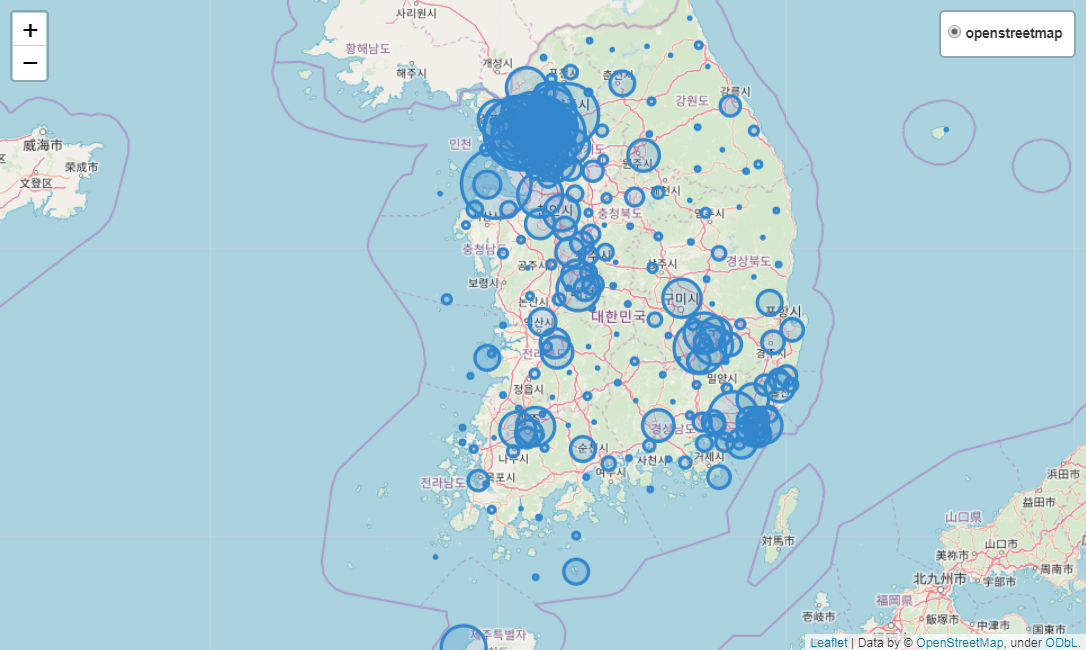
4. 행정구역별 인구현황 버블맵
choropleth를 통해 영역을 지정하고 색상으로 값을 표현했다면, CircleMarker을 통해 원의 크기로 값을 표현할 수 있다.
버블차트를 구현하기 전에 우선 행정구역별 중심좌표를 구해야 한다.
1) json 로드
import json
json_data=open(state_geo).read()
jsonResult = json.loads(json_data)
2) 함수 생성
# 중앙위치 계산
def center_calc(points_df):
    x = points_df.x
    y = points_df.y

    X = (max(x)+min(x))/2.
    Y = (max(y)+min(y))/2.

    return X, Y
# 다중 Array 구조 이중으로 변환
def points_array(points):

    final_points = []

    for x in range(0, len(points)):

        if len(points[x]) == 2:
            final_points.append(points[x])
        else:
            target = points[x]
            for y in range(0, len(target)):
                final_points.append(target[y])

    return final_points
3) 구역별 중심 DataFrame 생성
center_locations = pd.DataFrame()
codes = []
names = []
x_list = []
y_list = []
for x in range(0, len(jsonResult['features'])):
    code = jsonResult['features'][x]['properties']['SIG_CD']
    name = jsonResult['features'][x]['properties']['SIG_KOR_NM']
    # 중앙값 생성
    points = jsonResult['features'][x]['geometry']['coordinates'][0]
    points = points_array(points)
    points_df = pd.DataFrame(points)
    points_df.columns = ['x','y']
    X, Y = center_calc(points_df)

    # 결과
    codes.append(code)
    names.append(name)
    x_list.append(X)
    y_list.append(Y)

# 데이터 프레임 생성
center_locations['CODE'] = codes
center_locations['NAME'] = names
center_locations['X'] = x_list
center_locations['Y'] = y_list
4) 위치정보와 인구현황데이터 병합
target_df = pd.merge(state_data,center_locations, how = 'left', on = 'CODE')
target_df = target_df[~np.isnan(target_df['X'])] # 위치 정보 없는 값 제외
5) 버블차트 생성
# Initialize the map:
m = folium.Map(location=[36, 127], tiles="OpenStreetMap", zoom_start=7)


# I can add marker one by one on the map
for i in range(0,len(target_df)):
    latitude = target_df.iloc[i]['Y']
    longitude = target_df.iloc[i]['X']
    location=(latitude, longitude)
    folium.CircleMarker(location, radius=target_df.iloc[i]['POPULATION']/25000,color='#3186cc',fill_color='#3186cc', popup=target_df.iloc[i]['NAME']).add_to(m)


folium.LayerControl(collapsed=False).add_to(m)

# Save to html
m.save(os.path.join('datas', 'kr_polulation.html'))
m
# webbrowser.open_new("kr_polulation.html")
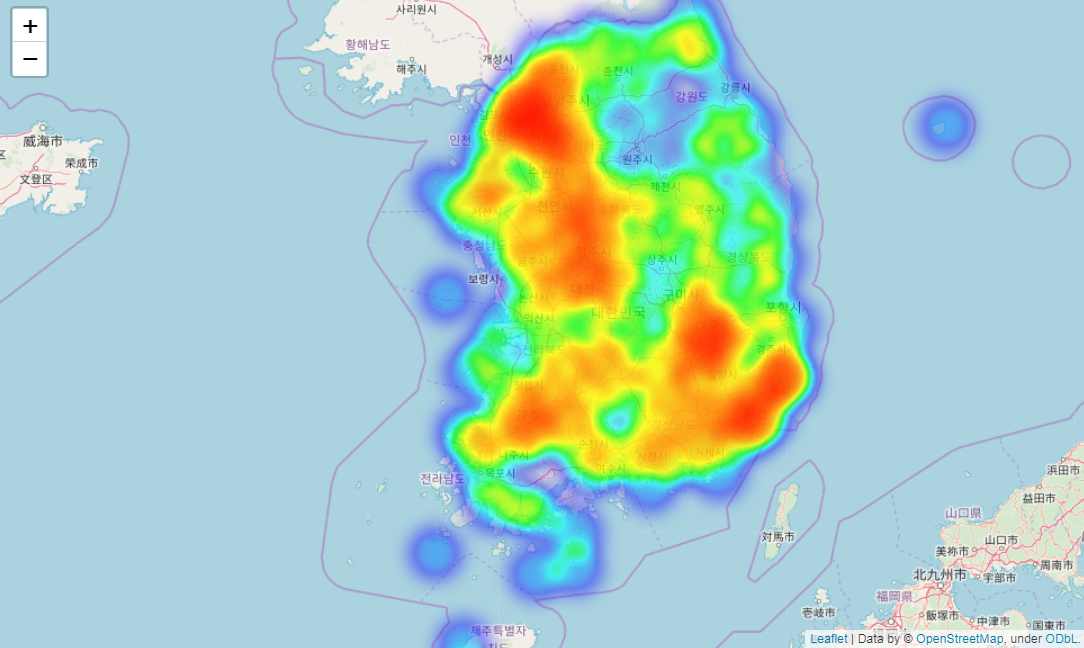
5. 행정구역별 인구현황 히트맵
from folium import plugins
from folium.plugins import HeatMap


m = folium.Map(location=[36, 127], tiles="OpenStreetMap", zoom_start=7)

heat_df = target_df[['Y', 'X']]

# List comprehension to make out list of lists
heat_data = [[row['Y'],row['X']] for index, row in heat_df.iterrows()]

# Plot it on the map
HeatMap(heat_data).add_to(m)

# Display the map
m
Reference
- https://blog.naver.com/PostView.nhn?blogId=kcchang61&logNo=221350672356
또다른 json 제공 링크
- https://github.com/southkorea/southkorea-maps/tree/master/kostat