* 본 포스트는 개인연구/학습 기록 용도로 작성되고 있습니다.
[Python] folium를 활용한 지도 활용
By MK on August 11, 2019
위도 경도를 알면 folium를 활용해 지도에 쉽게 표시해볼 수 있다.
필요한 라이브러리
import requests
import json
import pandas as pd
from pandas.io.json import json_normalize
import os

import folium
from folium import plugins
print(folium.__version__)
1. 위도, 경도 정보 셋팅
target_df라는 DataFrame 변수에 미리 위도 경도가 포함된 데이터를 가져온다.
# 위도(latitude) 경도(longitude)
latitude = target_df['Y']
longitude = target_df['X']

temp.Y = 37.5722440
temp.X = 126.9759352
main_location = (temp.Y, temp.X) # 지도를 보여줄 떄 중심이 되는 위치
map_shic = folium.Map(location=main_location, zoom_start=8)
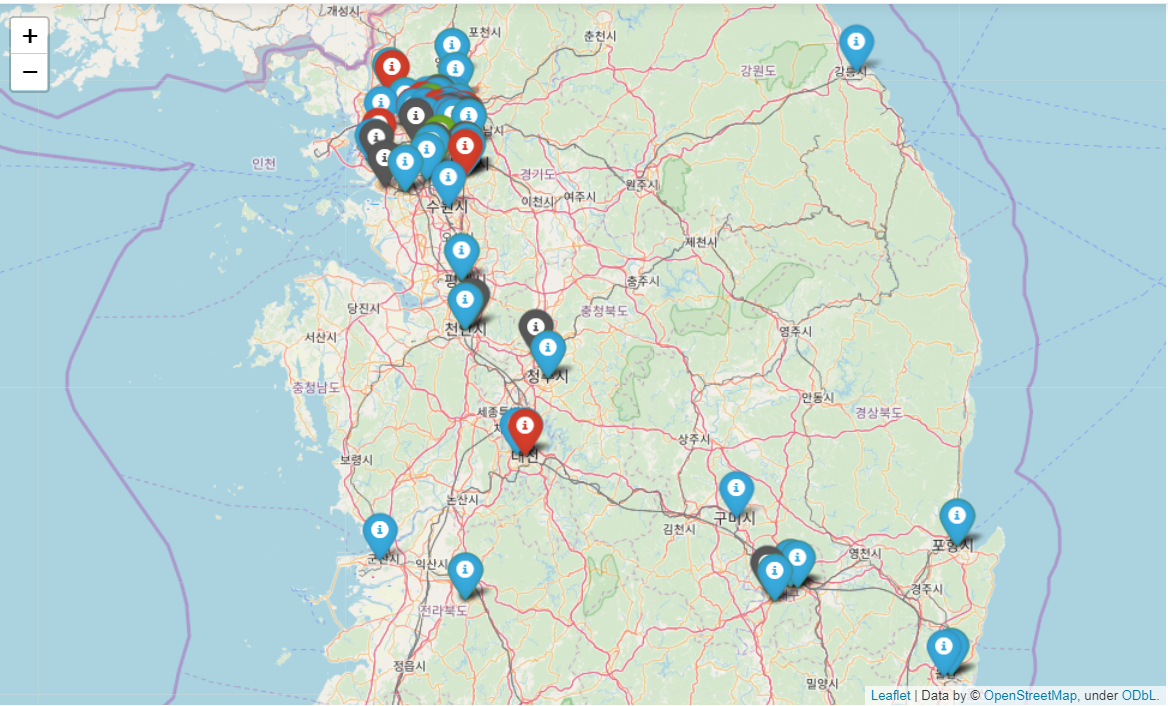
2. map에 location 지정
타입변수를 두고 유형별로 색상을 다르게 지정할 수도 있다.
사용가능 컬러
help(folium.Icon) 을 통해 보다 많은 정보를 얻을 수 있다.
‘red’, ‘blue’, ‘green’, ‘purple’, ‘orange’, ‘darkred’, ’lightred’, ‘beige’, ‘darkblue’, ‘darkgreen’, ‘cadetblue’, ‘darkpurple’, ‘white’, ‘pink’, ‘lightblue’, ‘lightgreen’, ‘gray’, ‘black’, ‘lightgray’
for x in range(len(target_df)):

    if target_df['type'][x] == 'A':
        color = 'blue'
    elif target_df['type'][x] == 'B':
        color = 'red'
    elif target_df['type'][x] == 'C':
        color = 'green'
    elif target_df['type'][x] == 'D':
        color = 'gray'
    else:
        color = 'white'  # 미확인

    location = (latitude[x],longitude[x])
    folium.Marker(location, popup=target_df['store'][x], icon=folium.Icon(color = color)).add_to(map_test)

map_test.save(os.path.join('datas', 'map_test.html')) # 저장하기
map_test
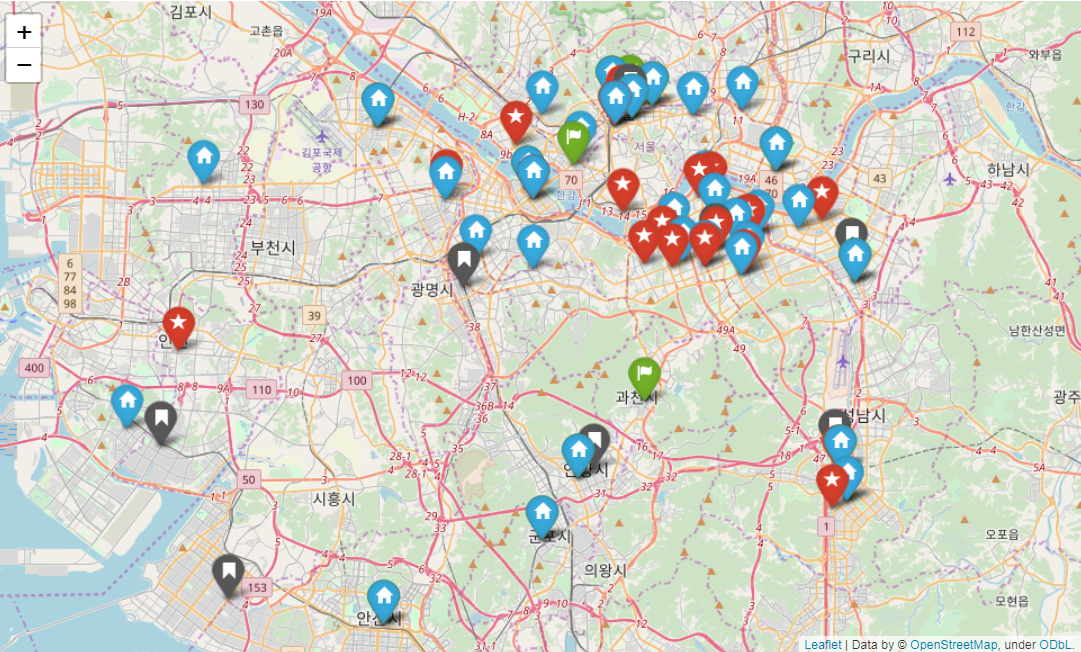
3. 아이콘 변경하기
info-sign 이고 fontawesome 아이콘을 설정할 수 있다.
아래 링크에서 원하는 아이콘을 찾아 설정해보자.(단, 모든 아이콘이 적용되진 않는다. test해볼 것)
https://fontawesome.com/icons?from=io
아래 코드는 조건에 따라 icon 변수에 타입을 설정하고 매핑하도록 하였다.
icon=folium.Icon( icon = icon , color = color)
for x in range(len(target_df)):

    if target_df['type'][x] == 'A':
        color = 'blue'
        icon = 'home'
    elif target_df['type'][x] == 'B':
        color = 'red'
        icon = 'star'
    elif target_df['type'][x] == 'C':
        color = 'green'
        icon = 'flag'
    elif target_df['type'][x] == 'D':
        color = 'gray'
        icon = 'bookmark'
    else:
        color = 'white'  # 미확인

    location = (latitude[x],longitude[x])
    folium.Marker(location, popup=target_df['store'][x], icon=folium.Icon(icon = icon, color = color)).add_to(map_test)

map_test.save(os.path.join('datas', 'map_test.html')) # 저장하기
map_test
Reference
- https://python-visualization.github.io/folium/modules.html